A systematic approach makes ECG interpretation much easier: Rate, Rhythm, Axis.
1) Rate: 300 divided by the number of large squares between 2 consecutive R peaks or Total number of cycles in a 10 second strip x 6
<60 = Bradycardia
60-100= Normal
>100 = Tachycardia
2) Rhythm: Does a P wave come before every QRS complex? If yes, the heart is in sinus rhythm. If no, are there discernable normal P waves? Saw-tooth pattern? Atrial fibrillation?
Next, check PR interval. It should normally be 3-5 small squares long (0.12 - 0.20s). PR interval shortening (<0.12s) could be due to Wolff-Parkinson-White Syndrome - look for characteristic delta waves. PR interval elongation (>0.20s) could be due to 1st degree heart block.
Type 1 2nd degree heart block (Wenckebach) is when there is gradual increase in the PR elongation, then reset
Type 2 2nd degree heart block (Mobitz Type 2) is when there is 2:1, 3:1, 4:1 (2 P waves before every QRS, or 3 P waves before every QRS)
3rd degree heart block is when there is no association between the P wave and the Q wave
Next, check QRS complex width. Normal QRS complex is no wider than 3 small squares (<0.12s). If widened, look at V1 and V6 for bundle branch block (MaRRoW and WiLLiaM) That is, 'M' pattern in V1 and W in V6 = RBBB. 'W' pattern in V1 and 'M' in V6 = LBBB. If there is one solitary widened (>0.12s) QRS complex, it is likely to be an ectopic focus orginating in the ventricles
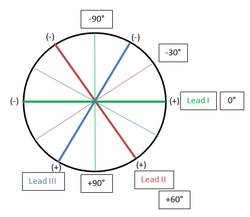
3) Axis: Look at Leads I, II and III.
If the amplitude of the S wave is > than amplitude of the R wave in Lead I (Lead I -ve), it means that the dominant vector is between -90° and +90° (Right axis deviation).
If the amplitude of the S wave is > than amplitude of the R wave in Lead II (Lead II -ve), then the dominant vector lies between +150° and -30°.
If the amplitude of the S wave is > than amplitude of the R wave in Lead III (Lead III -ve), then the dominant vector lies between -210° and +30°.
Left axis deviation is when the dominant vector lies between -30° and -90°. This can only occur if Lead I is +ve and Leads II and III are -ve (Overlap of all 3 possible areas where the dominant vector can lie in).
4) Scan all leads for pathological Q waves (> 1/3 height of QRS complex or >0.04s (1 small box wide), >2mm deep (2 small boxes deep)), ST wave depression and elevation, and inverted T waves.
1) Rate: 300 divided by the number of large squares between 2 consecutive R peaks or Total number of cycles in a 10 second strip x 6
<60 = Bradycardia
60-100= Normal
>100 = Tachycardia
2) Rhythm: Does a P wave come before every QRS complex? If yes, the heart is in sinus rhythm. If no, are there discernable normal P waves? Saw-tooth pattern? Atrial fibrillation?
Next, check PR interval. It should normally be 3-5 small squares long (0.12 - 0.20s). PR interval shortening (<0.12s) could be due to Wolff-Parkinson-White Syndrome - look for characteristic delta waves. PR interval elongation (>0.20s) could be due to 1st degree heart block.
Type 1 2nd degree heart block (Wenckebach) is when there is gradual increase in the PR elongation, then reset
Type 2 2nd degree heart block (Mobitz Type 2) is when there is 2:1, 3:1, 4:1 (2 P waves before every QRS, or 3 P waves before every QRS)
3rd degree heart block is when there is no association between the P wave and the Q wave
Next, check QRS complex width. Normal QRS complex is no wider than 3 small squares (<0.12s). If widened, look at V1 and V6 for bundle branch block (MaRRoW and WiLLiaM) That is, 'M' pattern in V1 and W in V6 = RBBB. 'W' pattern in V1 and 'M' in V6 = LBBB. If there is one solitary widened (>0.12s) QRS complex, it is likely to be an ectopic focus orginating in the ventricles
3) Axis: Look at Leads I, II and III.
If the amplitude of the S wave is > than amplitude of the R wave in Lead I (Lead I -ve), it means that the dominant vector is between -90° and +90° (Right axis deviation).
If the amplitude of the S wave is > than amplitude of the R wave in Lead II (Lead II -ve), then the dominant vector lies between +150° and -30°.
If the amplitude of the S wave is > than amplitude of the R wave in Lead III (Lead III -ve), then the dominant vector lies between -210° and +30°.
Left axis deviation is when the dominant vector lies between -30° and -90°. This can only occur if Lead I is +ve and Leads II and III are -ve (Overlap of all 3 possible areas where the dominant vector can lie in).
4) Scan all leads for pathological Q waves (> 1/3 height of QRS complex or >0.04s (1 small box wide), >2mm deep (2 small boxes deep)), ST wave depression and elevation, and inverted T waves.
 RSS Feed
